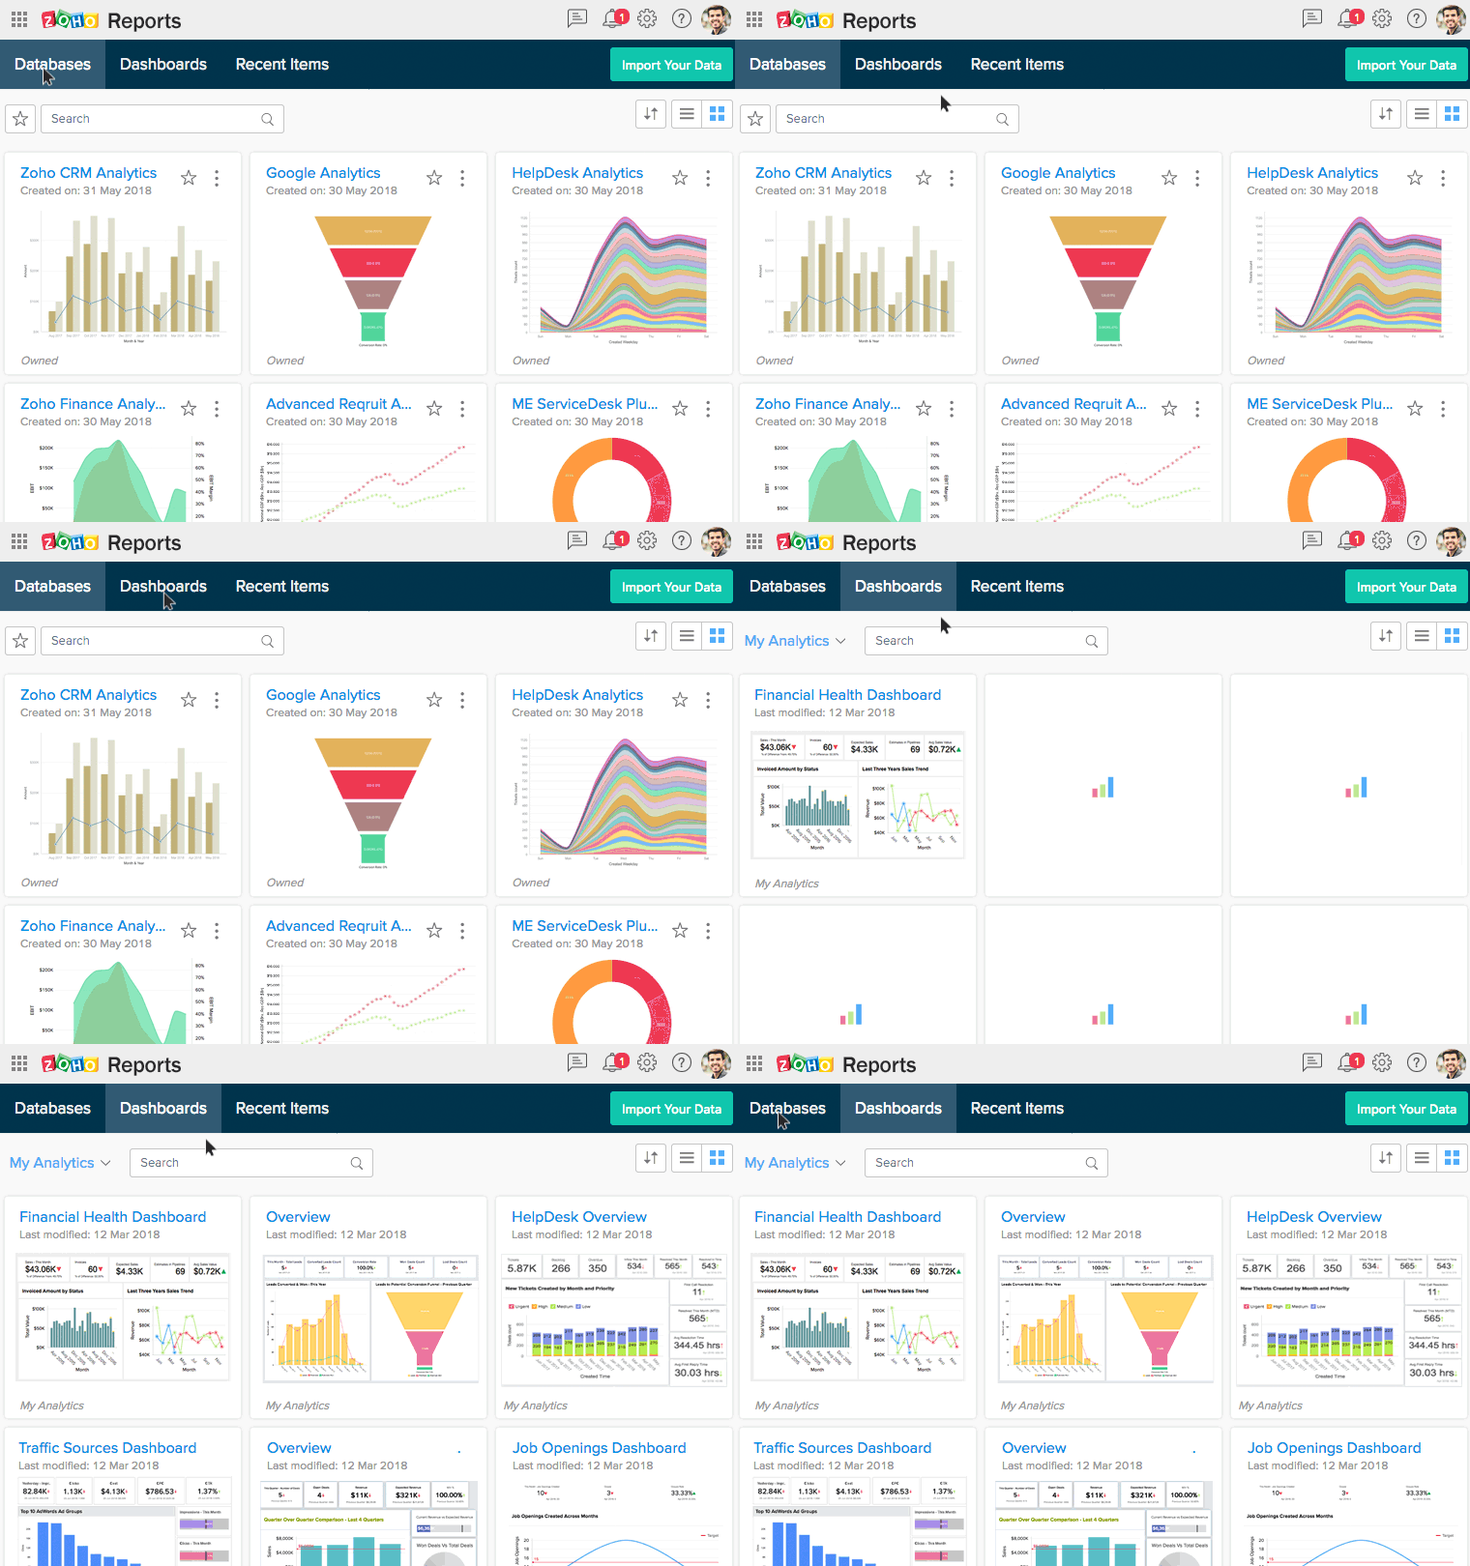
Zoho Reports is your ultimate marketing partner if you’re responsible for marketing your business, you already know… It’s all about the numbers. Sometimes, uncovering and interpreting those numbers can feel like trying to assemble a poorly cut jigsaw puzzle. It just doesn’t fall into place. Zoho Reports changes all that by allowing small and medium-sized businesses an at-a-glance look at Business Intelligence reporting.
If you have been using one of the products that integrate with Zoho Reports (CRM, Books, Support, Campaigns, etc), for a while, then it is time to analyzing that valuable data.
Visualize Data with Zoho Reports
Zoho Reports makes understanding your data easily a priority. The biggest benefit to using an easy to understand reporting tool is that you can quickly discover hidden information in your data. Once revealed, this data allows for more informed decision making. Uncovering the data is easy because Zoho Reports is very visual.
From just one customized or pre-loaded dashboard, you can see a number of charts to show you this data. You can also blend data, add additional reports and pull key metrics. This will help you gain a better understanding of what’s happening in your business. All of your data will live inside dashboards.
Dashboards
A Zoho Reports Dashboard is a way to organize reports and view insights on one page. Rather than offering one default dashboard, Zoho allows you to create your own Dashboards with a simple drag and drop feature.

This clip of Zoho Reports gives a glimpse of some of the visual reporting capabilities Zoho provides.
Pull in reports, widgets, and format text into single or double columns to create a visually appealing home for your data. You can also create a single number chart to focus in on one key metric. Add comparison indicators and highlight trends to get a better understanding of your data.
Zoho Reports allows you the ability to create these metrics using Formulas. It comes equipped with a formula engine. It allows users to create various calculations to help enhance reporting abilities.
When you’re ready, you can turn that data into Charts. Zoho Reports Charts are visual representations of data. It supports over 25 different kinds, so you can create a visual to support your needs.
Fully Featured BI (Business Intelligence)
Zoho Reports easily integrates with Zoho CRM, like the other apps inside the Zoho suite, Desk, BugTracker, Projects, Campaigns, Survey, Creator, Recruit, and People. The integration automatically pulls in data on a regular basis for quick and up-to-date information. Reports can also “talk” to other programs that house your most important data. For example, Stripe, Google Analytics, Google AdWords, Mail Chimp, Survey Monkey, or Twitter Competitive Analysis.
These integrations allow for a fully-featured BI, not simply snippets of data presented in isolation. When you integrate with a new app, you’ll see a number of dynamic visualization options. These options are pre-stocked with default reports so you can instantly focus on important metrics.
Take it a step further by mixing data from one source with data from another source for more meaningful insights. For instance, pull in data from Zoho CRM, then blend it with Zoho Books and see a full picture of what’s happening with your prospects and customers, no matter where your data lives.
The ease of use, quick visualizations, and Business Intelligence make Zoho Reports an excellent choice for anyone using the Zoho product line in their business.
With powerful integrations, you’ll finally be able to crack the code on your most important business data and make better, more informed business decisions at every step of the way.

Recent Comments